









The commercial real estate environment improved this quarter, with deals closing, net operating income growing across most sectors, and office occupancy posting its strongest rebound in years. On the flip side, financing moved in the opposite direction. Rising Treasury yields pushed the premium for owning real estate over bonds to one of its thinnest levels in a decade, creating a potential headwind for future valuations. Over the next several quarters, returns are more likely to be driven by asset performance rather than by the purchase price.
1. Multifamily deal volume breaks a three-year freeze
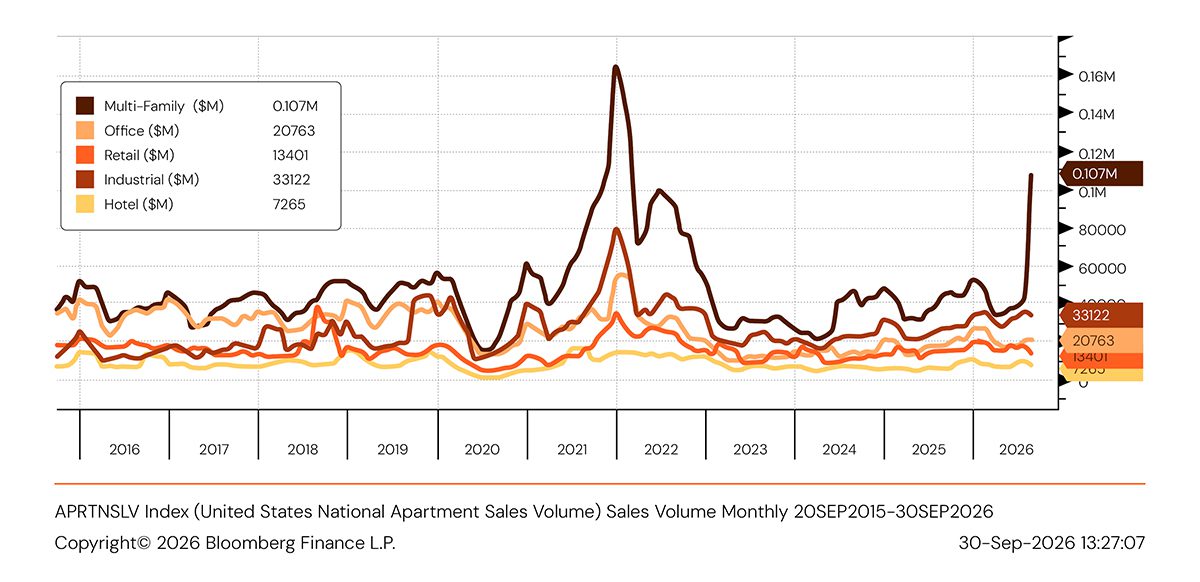
U.S. commercial real estate sales volume
Source: Bloomberg Finance L.P.
Multifamily sales volume jumped to roughly two and a half times its recent pace, reaching the highest level since the 2021 to 2022 boom. Industrial activity is also trending higher, while office, retail, and hotel volumes remain steady though more subdued. After three years of buyers and sellers standing on opposite sides of the room, multifamily deals are moving forward again.
What this means for you: Liquidity is returning to the multifamily market. More closed deals provide better price discovery, which can help inform appraisals, lender conversations, and property valuations in the current interest rate environment. Multifamily owners considering a sale now have a window that has largely been unavailable for the past three years. One note of caution: a spike in transaction volume can be driven by a handful of large portfolio deals, so watch whether volume activity holds another quarter or two before calling it a trend.
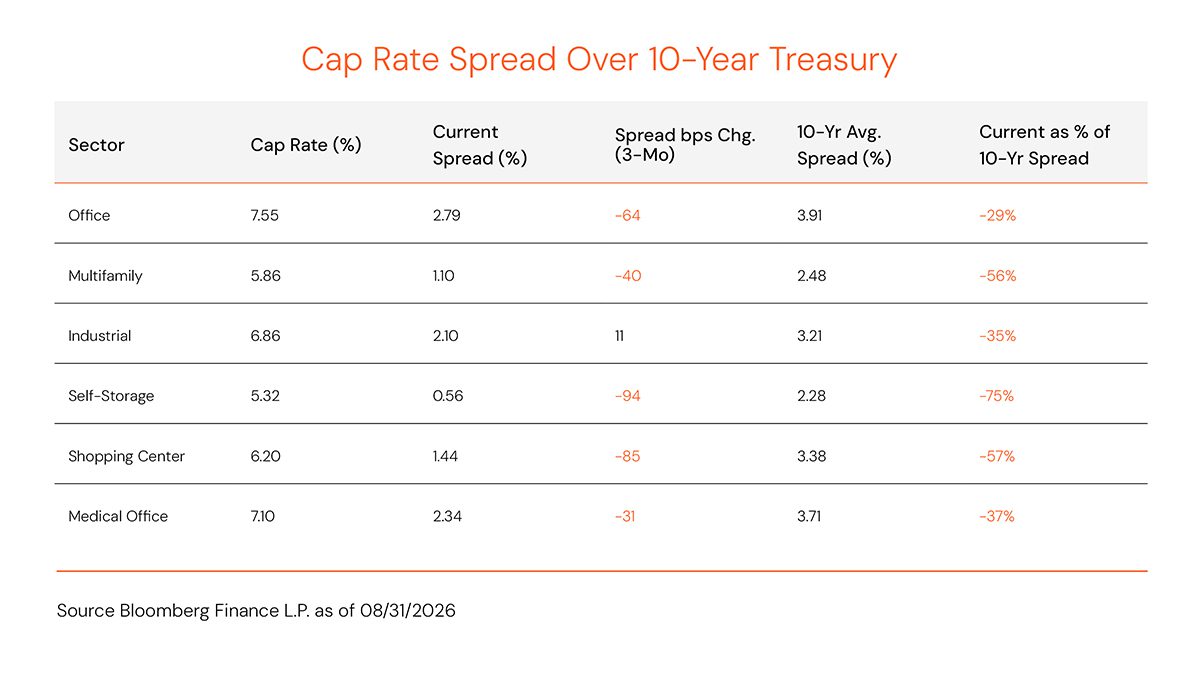
2. Cap rate spreads keep narrowing, and the bond market did it
Source: Bloomberg Finance L.P. as of 08/31/2026
Note: The narrower the spread, the less additional return an asset owner receives for taking on the added risk of owning that asset compared to a risk-free asset, such as the U.S. 10-Year Treasury bond.
The spread is calculated by subtracting the Treasury yield from the cap rate. When the Treasury yield rises, and cap rates hold, the spread narrows automatically. Treasury yields reprice daily, while cap rates reprice through appraisals, closed sales, and lender reviews, which run quarters behind. The narrowing shown in this chart reflects the bond market moving first.
Spreads narrowed in five of six sectors. Self-storage tightened the most, by 94 basis points, and now sits 0.56% above the 10-year Treasury, 75% below its 10-year average. The primary driver is the bond market: the 10-year Treasury yield rose from 4.47% on June 30 to 5.24% on September 30, an increase of 77 basis points.
What this means for you: This is the most significant risk in this quarter’s data. The gap will most likely close from the property side. If the 10-year Treasury remains near 5.24%, cap rates are likely to rise to restore spreads closer to historical norms. A higher cap rate applied to the same income results in a lower value. Run your own numbers at cap rates 50 to 100 basis points above today’s levels and evaluate what happens to your equity, your loan-to-value, and your debt covenants. The exposure concentrates in two places: refinancings due within the next 18 to 24 months, and assets previously purchased at thin spreads.
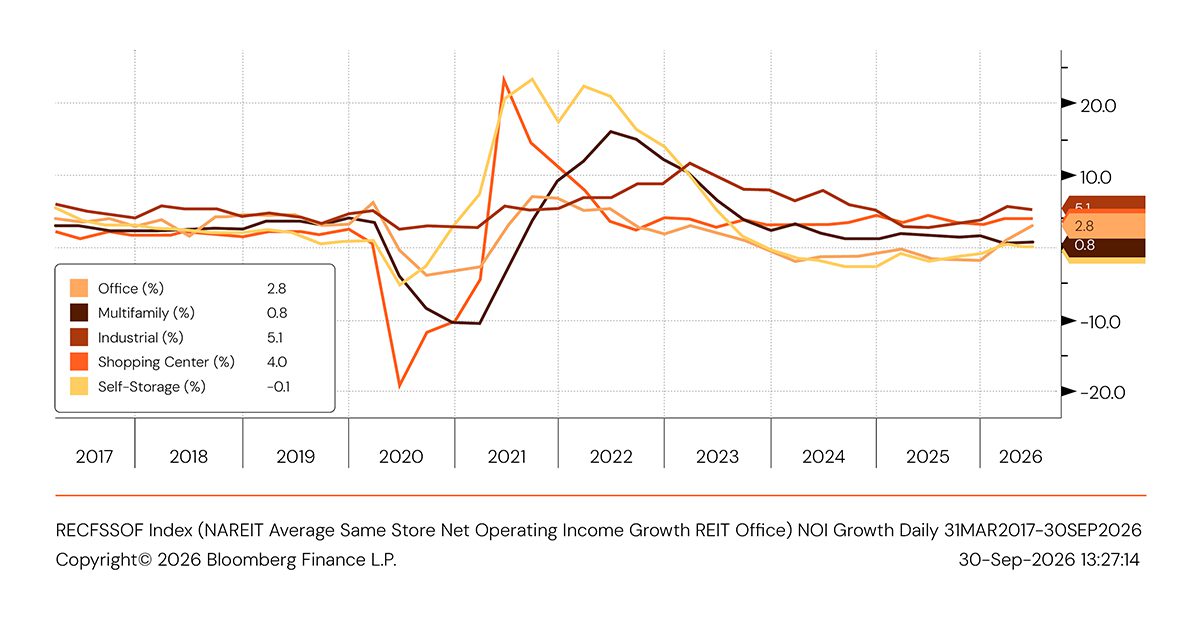
3. Income is growing in four of five sectors
Commercial real estate NOI growth
Source: Bloomberg Finance L.P.
Net operating income (NOI) is growing in four of five sectors. Industrial leads at 5.1% growth, followed by shopping centers and office. Multifamily remains challenged by a supply overhang in faster-growing markets. The most notable shift is in office, where NOI growth turned positive after remaining negative through much of 2025. These figures are based on publicly traded real estate investment trusts (REITs), which tend to own higher-quality buildings, so results across the broader market may be softer.
What this means for you: When cap rates rise, NOI growth can help offset the valuation pressure and hold asset value steady. Industrial, with NOI growth of 5.1%, and shopping centers, at 4.0%, provide that offset. By contrast, sectors that experienced greater supply growth during the low rate years, such as multifamily and self-storage, are generating little to no NOI growth, which could place additional pressure on asset values. The improvement in office comes from a low base and is concentrated in the best buildings, so it offers little insight into the outlook of an older building in a weak submarket. For multifamily and self-storage, the 2027 income story will depend on expense control, renewal strategy, and pricing discipline.
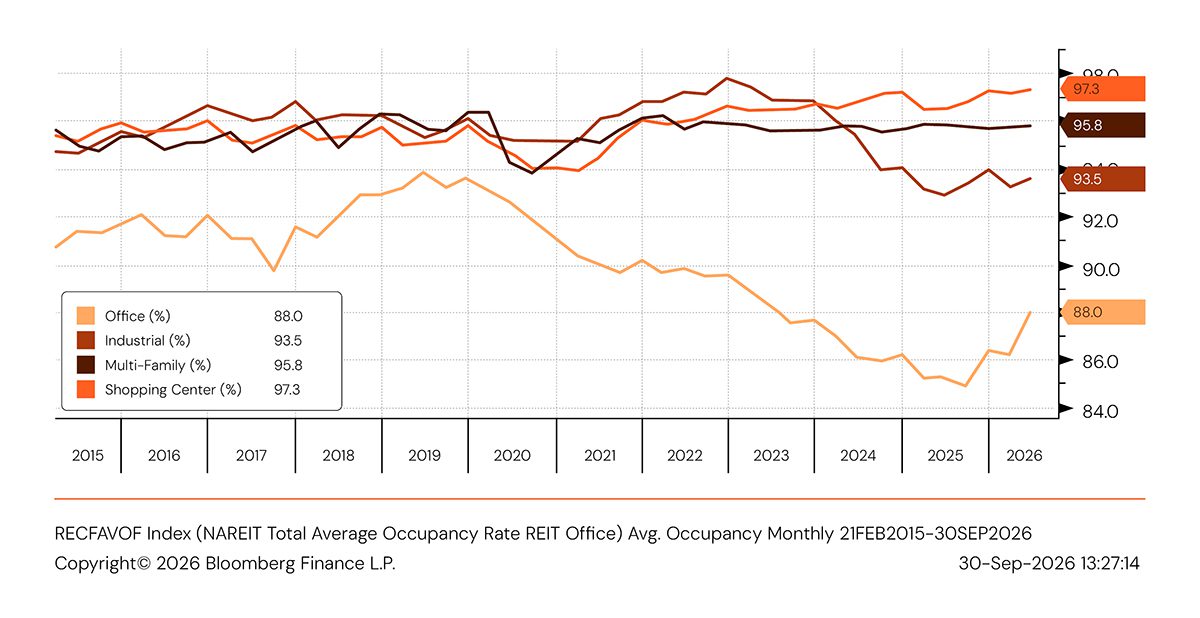
4. Office occupancy rebounds while other sectors hold near full
Avg. occupancy
Source: Bloomberg Finance L.P.
Office occupancy climbed to 88%, up from a low of roughly 85% in 2025. Shopping center occupancy remains close to full, while industrial has troughed after declining from its 2022 peak as a wave of new warehouse supply came online.
What this means for you: Occupancy drives rent collections, strengthens lender confidence, and improves an owner’s negotiating position at renewal. The dispersion in the office market has led to a real rebound in Class A and newer properties, while overall market occupancy sits about five points below its pre-pandemic level. Much of that gap is due to older, Class B & C properties that require capital to attract new tenants. In industrial, new supply is being absorbed, while in retail, near-full occupancy bonds well for future NOI growth.
5. Sunbelt vacancy may be peaking as other regions drift higher
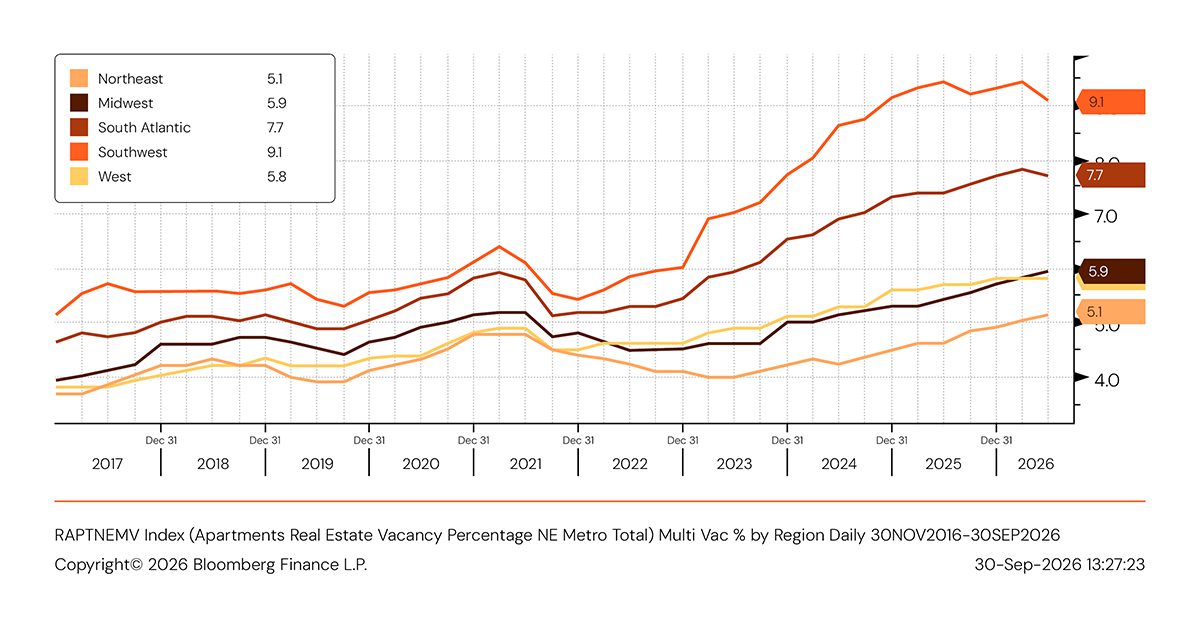
Multifamily vacancy by region
Source: Bloomberg Finance L.P.
Multifamily vacancy is highest in the Southwest at 9.1%, which includes markets such as Austin, TX and Phoenix, AZ, and in the South Atlantic at 7.7%. These regions experienced the most new construction during the boom, although vacancy rates in both appear to have peaked. Vacancy is lower in the Midwest at 5.9%, the West at 5.8%, and the Northeast at 5.1%, but rates in those regions have risen steadily. Every region remains above its 2022 level.
What this means for you: National rent headlines can be misleading. Owners in Phoenix or Atlanta may be closer to a turning point as new deliveries slow. With spreads tight relative to historical levels, valuations depend on vacancy declining enough to drive higher NOI growth. In other words, the underwriting environment for new deals leaves little room for error.
6. The development pipeline stays thin, and higher rates keep it there
Source: AIA Economics
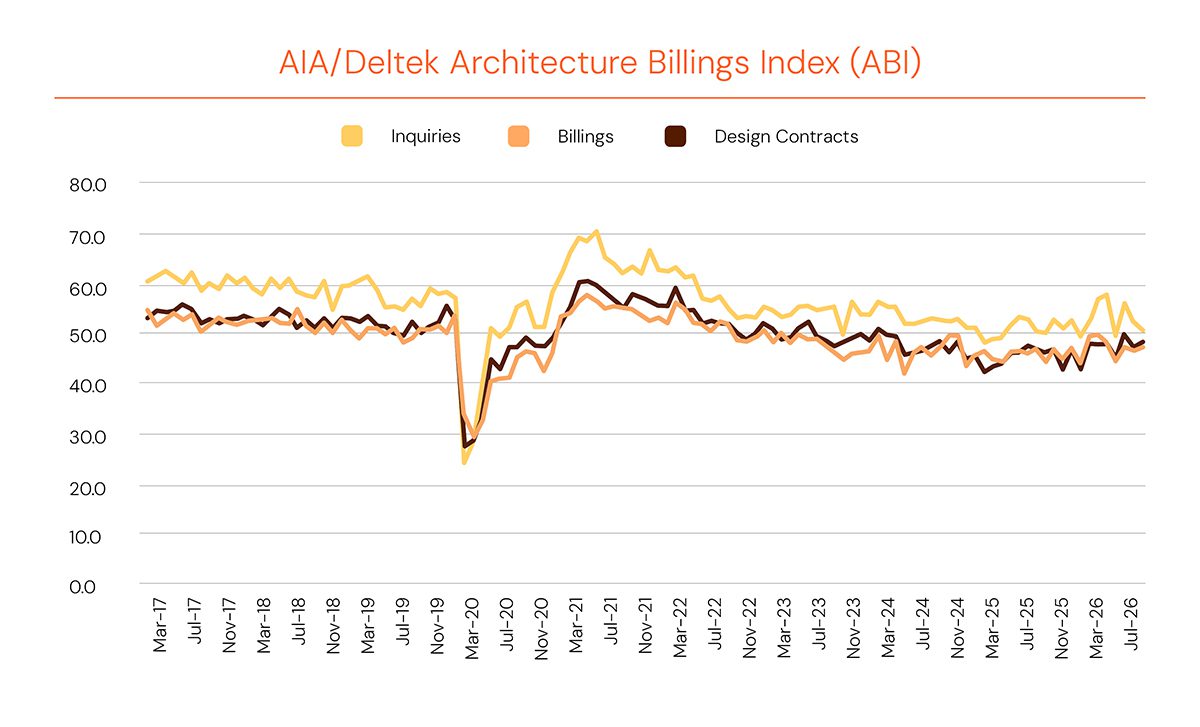
Billings and design contract indexes remain below 50, signaling continued contraction in design activity and extending a trend that began in late 2022. Inquiries spiked this spring but have since cooled to approximately 51. Although inquiries have remained mostly above 50 during this period, they have not consistently converted into signed contracts.
What this means for you: Developers are inquiring about projects without signing contracts, potentially reflecting concerns over the ability to finance projects at compelling returns. Fewer starts today mean less new competition in two to three years, a tailwind for existing, well-located assets and one reason Sunbelt multifamily vacancy should continue to improve. Higher interest rates reinforce this dynamic, benefiting owners of existing assets by making new development more expensive and raising replacement costs. Watch for inquiries to begin converting into signed contracts, the earliest signal that the supply outlook is changing. Until then, the better risk-adjusted return may come from renovating or repositioning assets you already own.
This commentary is brought to you by our advisors at Aprio.
Disclosures
Investment advisory services are offered by Aprio Wealth Management, LLC, a Securities and Exchange Commission Registered Investment Advisor. Opinions expressed are as of the publication date and subject to change without notice. Aprio Wealth Management, LLC shall not be responsible for any trading decisions, damages, or other losses resulting from, or related to, the information, data, analyses or opinions contained herein or their use, which do not constitute investment advice, are provided as of the date written, are provided solely for informational purposes and therefore are not an offer to buy or sell a security. This commentary is for informational purposes only and has not been tailored to suit any individual. References to specific securities or investment options should not be considered an offer to purchase or sell that specific investment.
This commentary contains certain forward-looking statements. Forward-looking statements involve known and unknown risks, uncertainties and other factors which may cause the actual results to differ materially and/or substantially from any future results, performance or achievements expressed or implied by those projected in the forward-looking statements for any reason. No graph, chart, or formula in this presentation can be used in and of itself to determine which securities to buy or sell, when to buy or sell securities, whether to invest using this investment strategy, or whether to engage Aprio Wealth Management, LLC’s investment advisory services.
Investments in securities are subject to investment risk, including possible loss of principal. Prices of securities may fluctuate from time to time and may even become valueless. Any securities mentioned in this commentary are not FDIC-insured, may lose value, and are not guaranteed by a bank or other financial institution. Before making any investment decision, investors should read and consider all the relevant investment product information. Investors should seriously consider if the investment is suitable for them by referencing their own financial position, investment objectives, and risk profile before making any investment decision. There can be no assurance that any financial strategy will be successful.
Certain investor qualifications may apply. Definitions for Qualified Purchaser, Qualified Client and Accredited Investor can be found from multiple sources online or in the SEC’s glossary found here https://www.sec.gov/education/glossary/jargon-z#Q.