


Commercial real estate continues to adjust to a higher-rate environment where financing is available but harder, and supply trends vary sharply by sector and metro. In that kind of market, outcomes may depend less on “calling the turn” and more on conservative underwriting and operating execution. Focus on emphasizing cash-flow control, greater understanding of local supply conditions, and using realistic financing assumptions.
1. Cap Rate Spreads Remain Tight, Even After Some Improvement
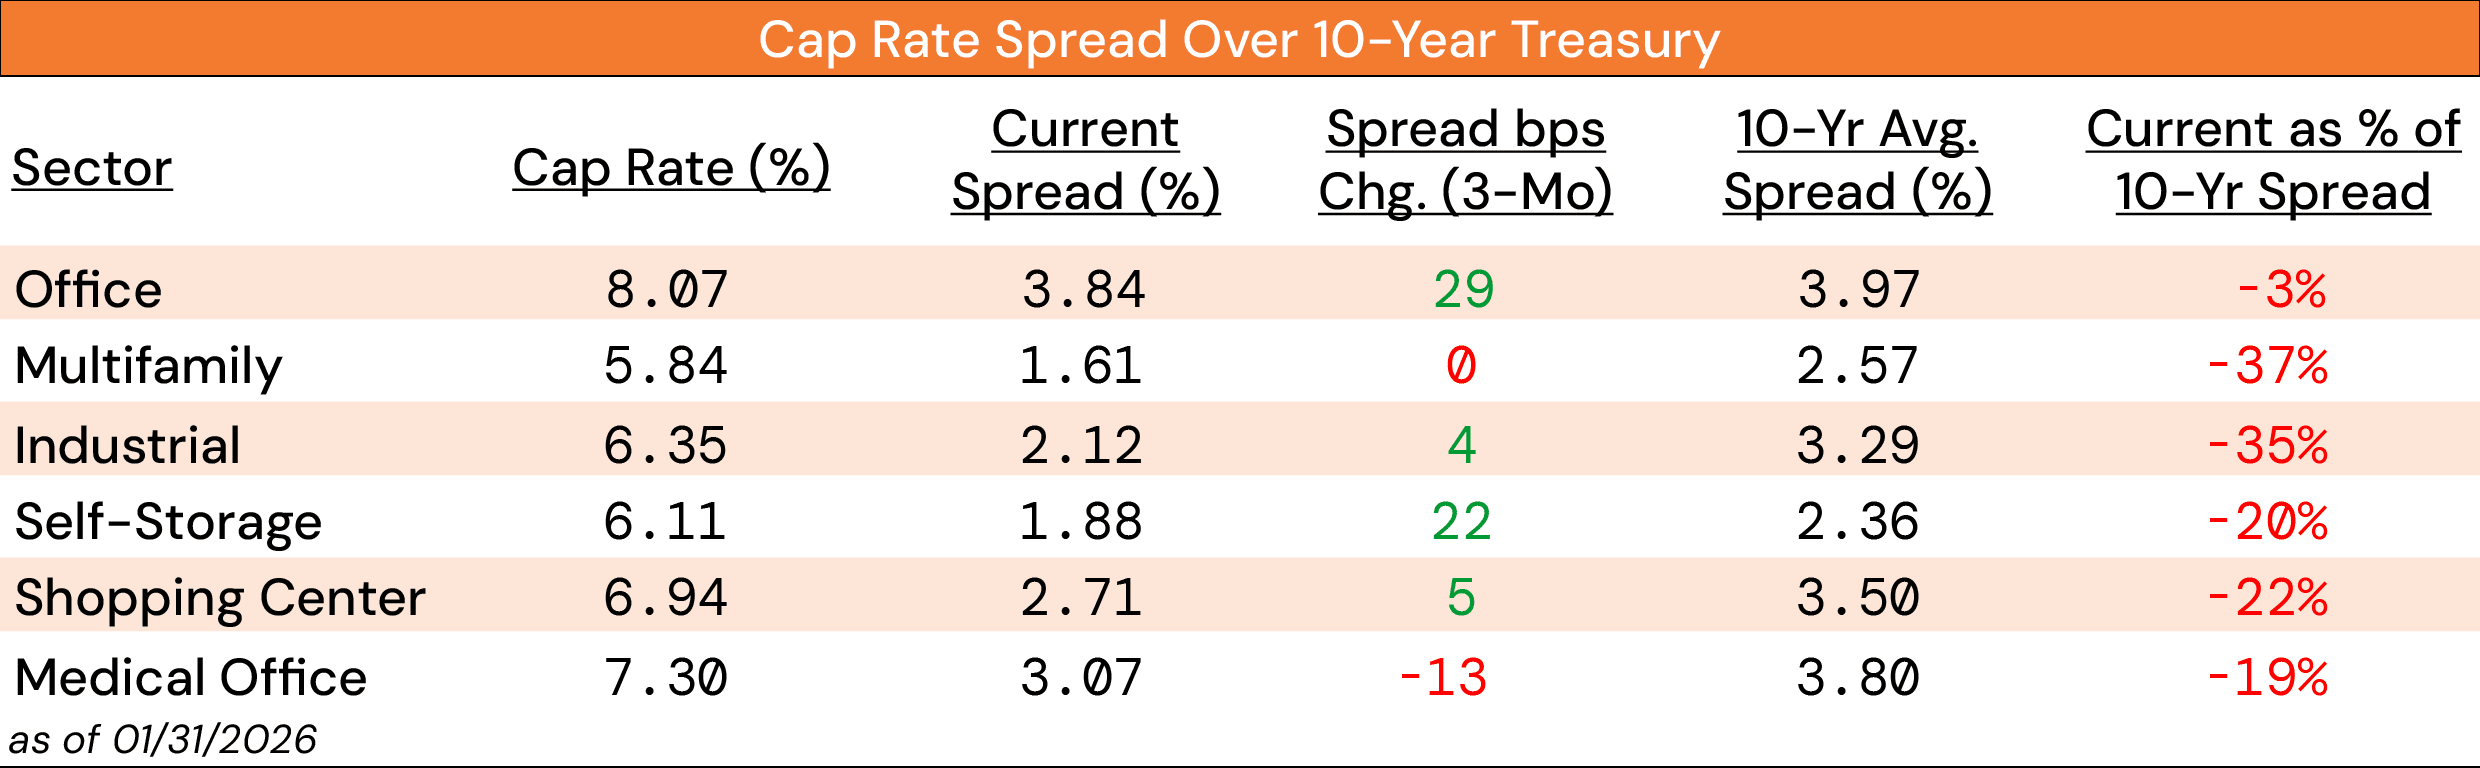
Source: RCA, NAREIT, & ICE Data Indices, LLC
Note: The narrower the spread, the less additional return an asset owner is receiving for the additional risk of owning that asset compared to a risk-free asset, such as the U.S.10-year Treasury bond.
Cap rate spreads widened slightly over the last quarter — most notably in office and self‑storage —but across most sectors they remain well below long‑term averages. Multifamily and industrial spreads are still roughly 35% below “normal,” which suggests investors may be receiving less incremental return over Treasuries for taking real estate risk.
What this means for you: Returns may need to rely more on income growth and operational execution than on cap rate contraction. With spreads still tight, there may be less cushion if leasing or expenses disappoint, so underwriting assumes conservative rent growth and persistent financing costs can be directionally safer. Consider focusing on deals in which you can influence cash flow through leasing and expense management, which may offer a clearer path to value creation.
2. New Development Pipeline Remains Weak
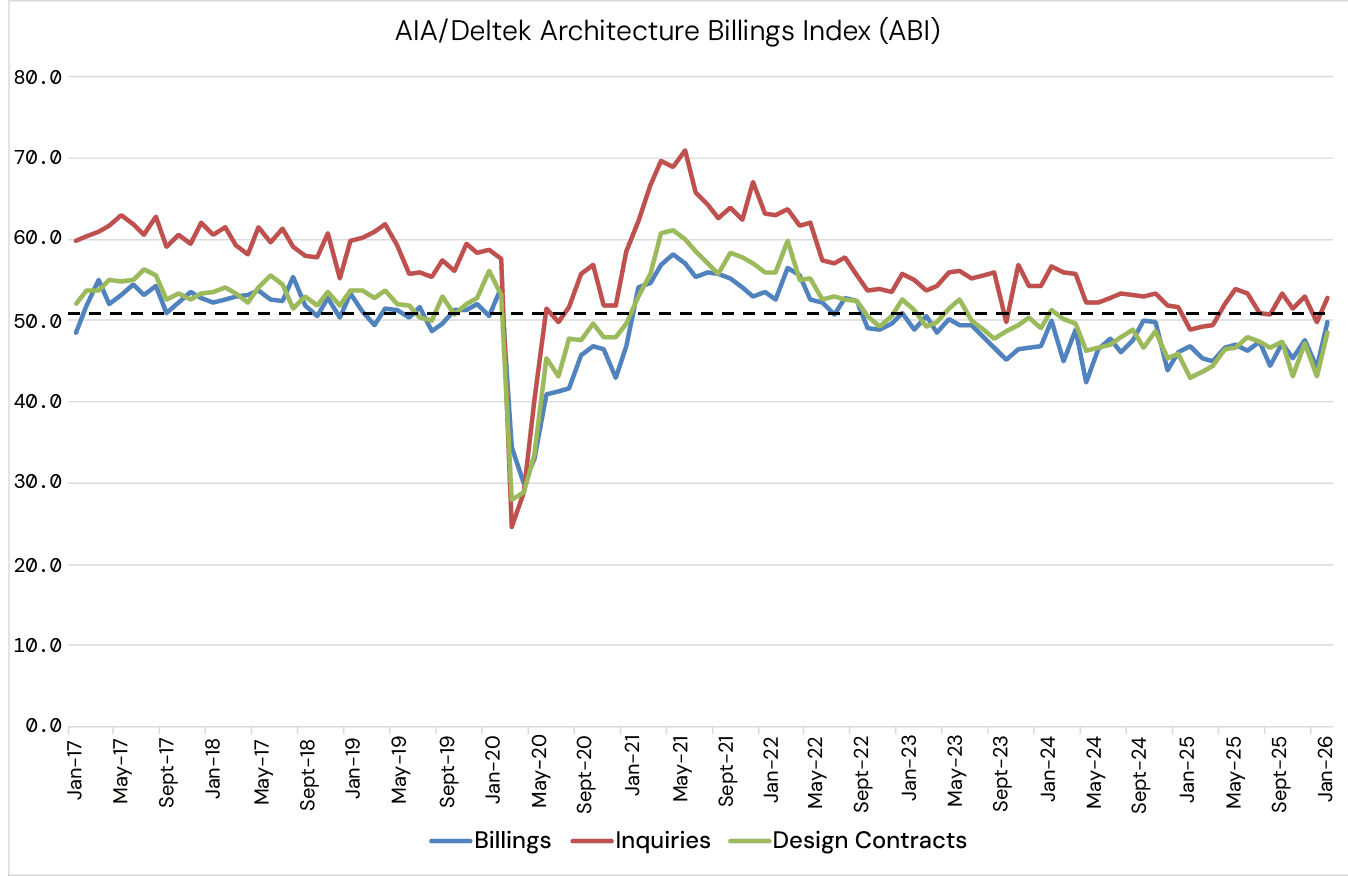
Source: AIA Economics
The Architecture Billings Index remains below 50, consistent with contraction in design activity, even though billings and design contracts improved in February. That combination suggests activity is still subdued, but there may be early signs of stabilization worth watching.
What this means for you: Less design activity today can translate into a more supportive supply backdrop over time, but the recent improvement could also indicate that some developers may be testing the waters. For now, existing assets may continue to benefit from limited new competition, and in many cases value-add strategies may look more attractive than ground-up development.
3. Occupancy is Strong — Except for Office
Avg. Occupancy
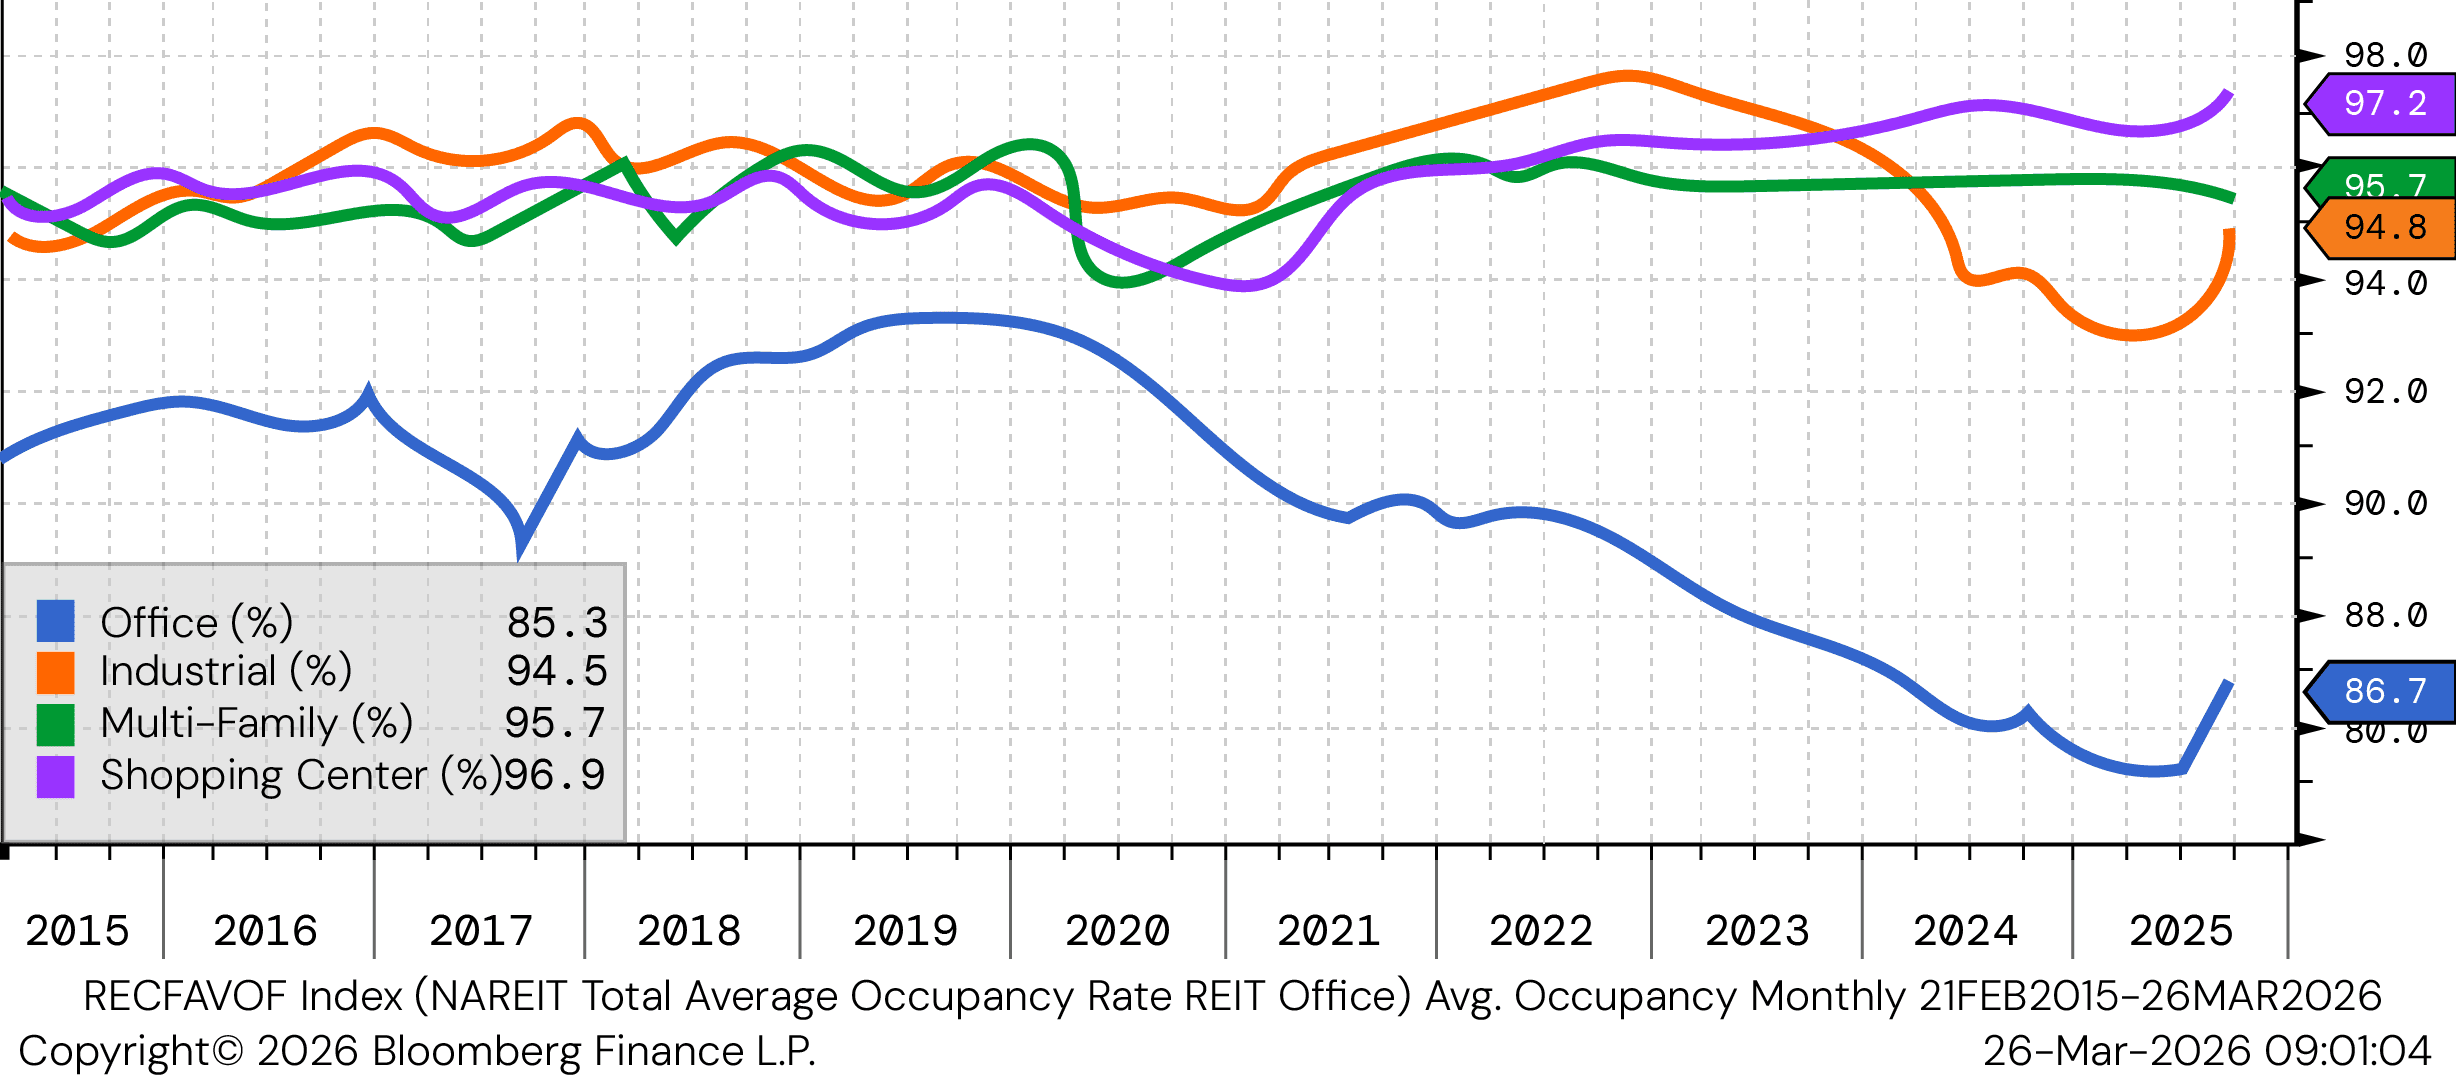
Source: Bloomberg Finance L.P.
Industrial, retail, and multifamily are still operating around mid‑90% occupancy, while office remains well below other sectors; office and industrial occupancy modestly rebounded in Q4 2025 after a period of decline. High occupancy typically matters because it can support rent collections, reduce rollover pressure, and improve financing conversations — while lower office occupancy can keep leverage on the tenant side.
What this means for you: For non‑office assets, the occupancy backdrop may support a “protect the base” strategy — prioritizing retention, targeted capex, and disciplined expense control. For office, assumptions may need wider ranges (i.e., lease‑up time, TI/LC, renewal probability), and business plans may benefit from underwriting to slower absorption rather than a quick normalization.
4. Transaction Activity is Stabilizing, but Still Selective
U.S. Commercial Real Estate Sales Volume
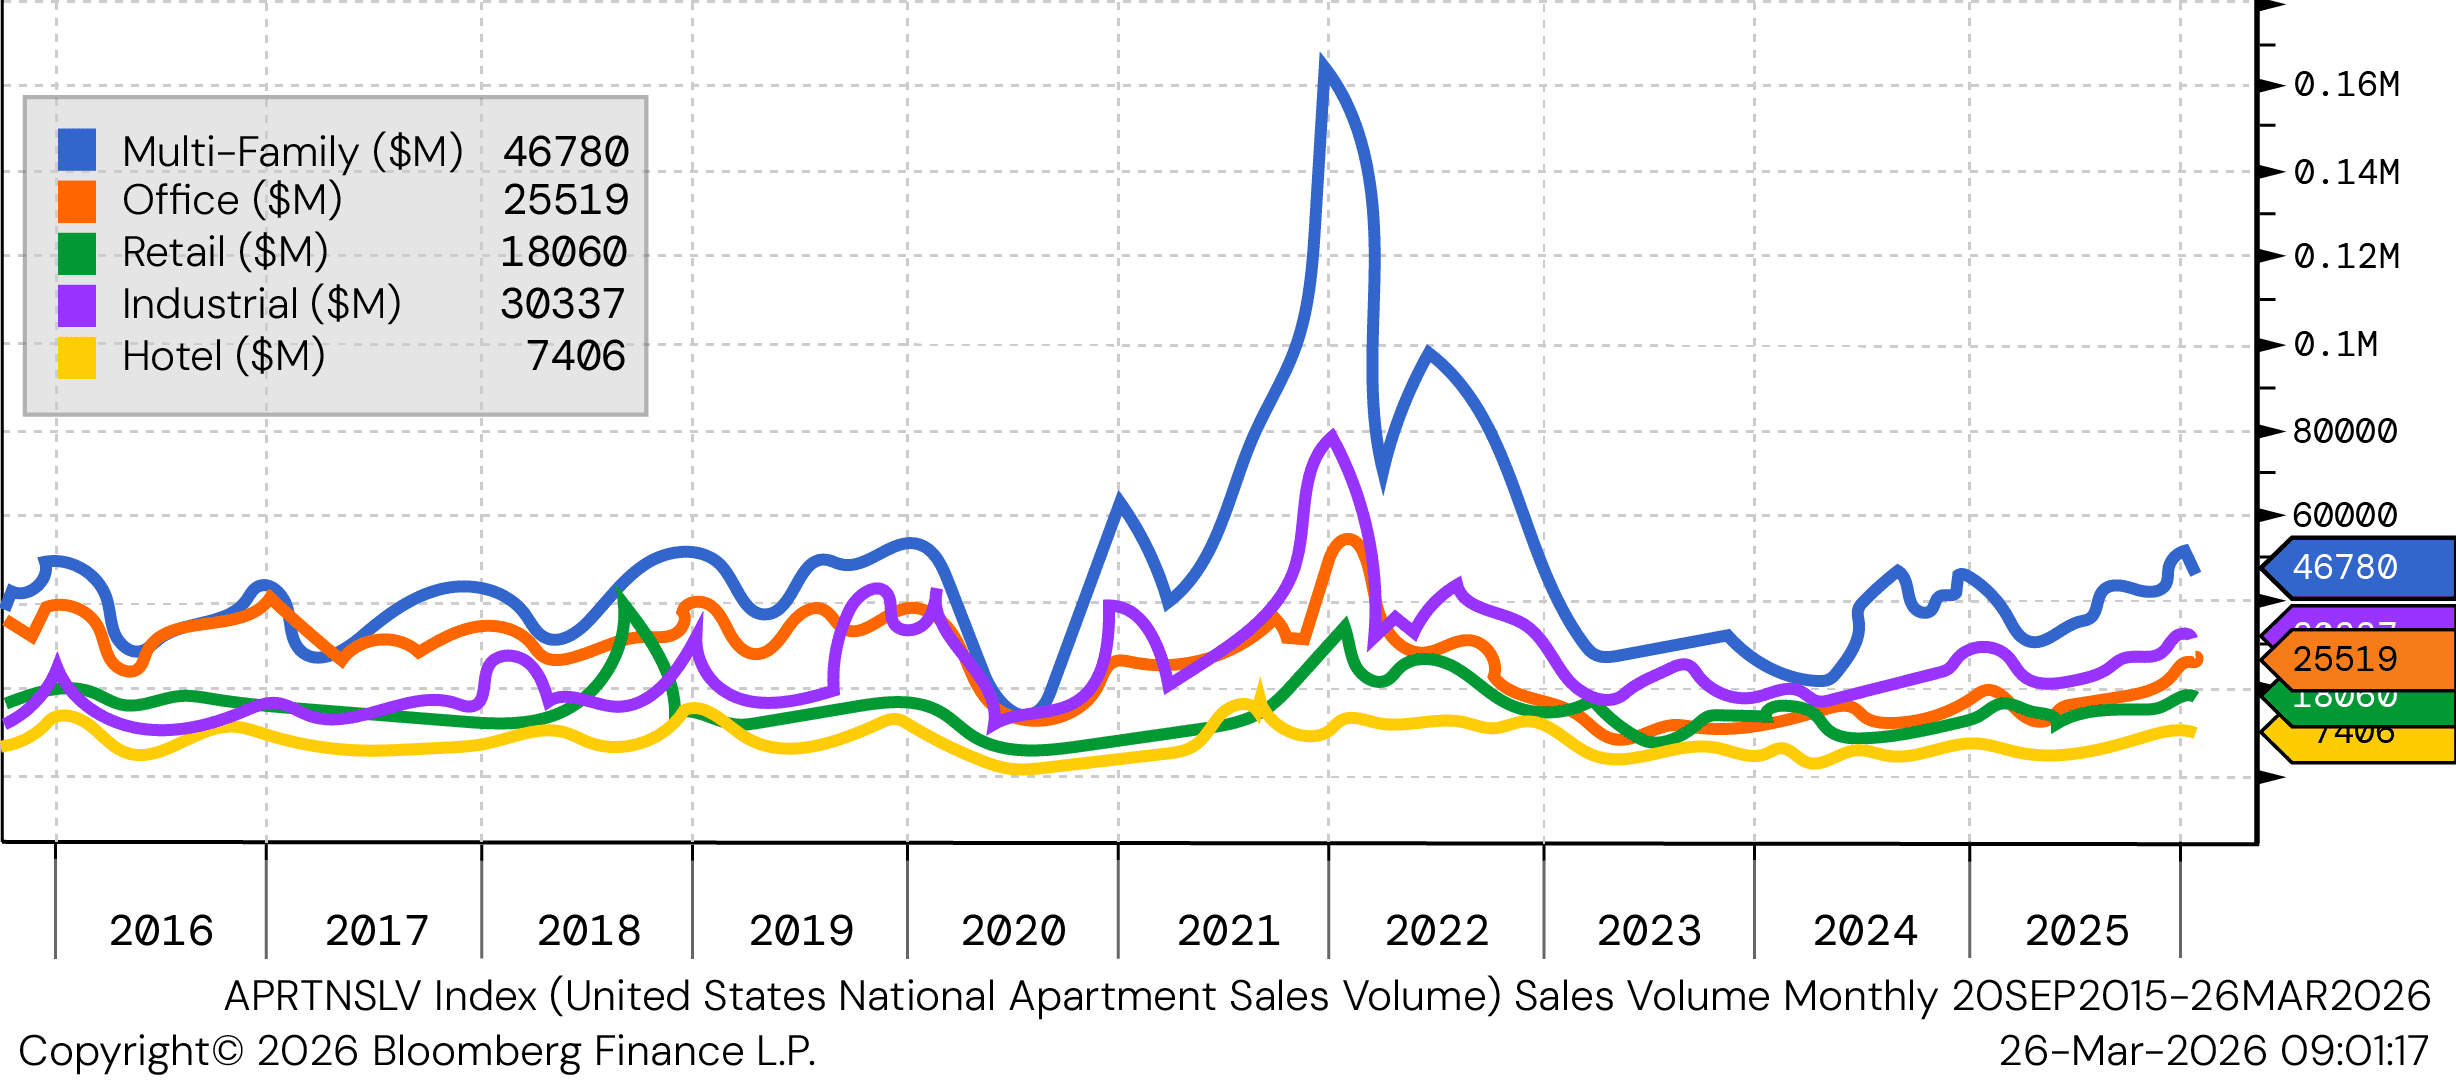
Source: Bloomberg Finance L.P.
Sales volume has picked up modestly across most sectors — especially in multifamily and industrial — but activity remains well below prior cycle highs, and capital is still described as cautious. Transaction activity matters because liquidity can influence appraisal marks, refinance options, and the feasibility of selling non‑core assets.
What this means for you: This looks like a market where transactions may happen when pricing and financing assumptions reflect current rates and terms, not optimistic scenarios. Well-leased, high-quality assets may continue to be more liquid, while deals that depend on aggressive assumptions or rapid rate cuts could face more friction. If you’re a seller, preparing a “clean story” around durable cash flow and realistic capex may improve outcomes. If you’re a buyer, you may gain an edge by insisting on conservative underwriting.
5. Multifamily Supply is Falling, but Pressure Isn’t Gone Yet
Multifamily Homes Under Construction
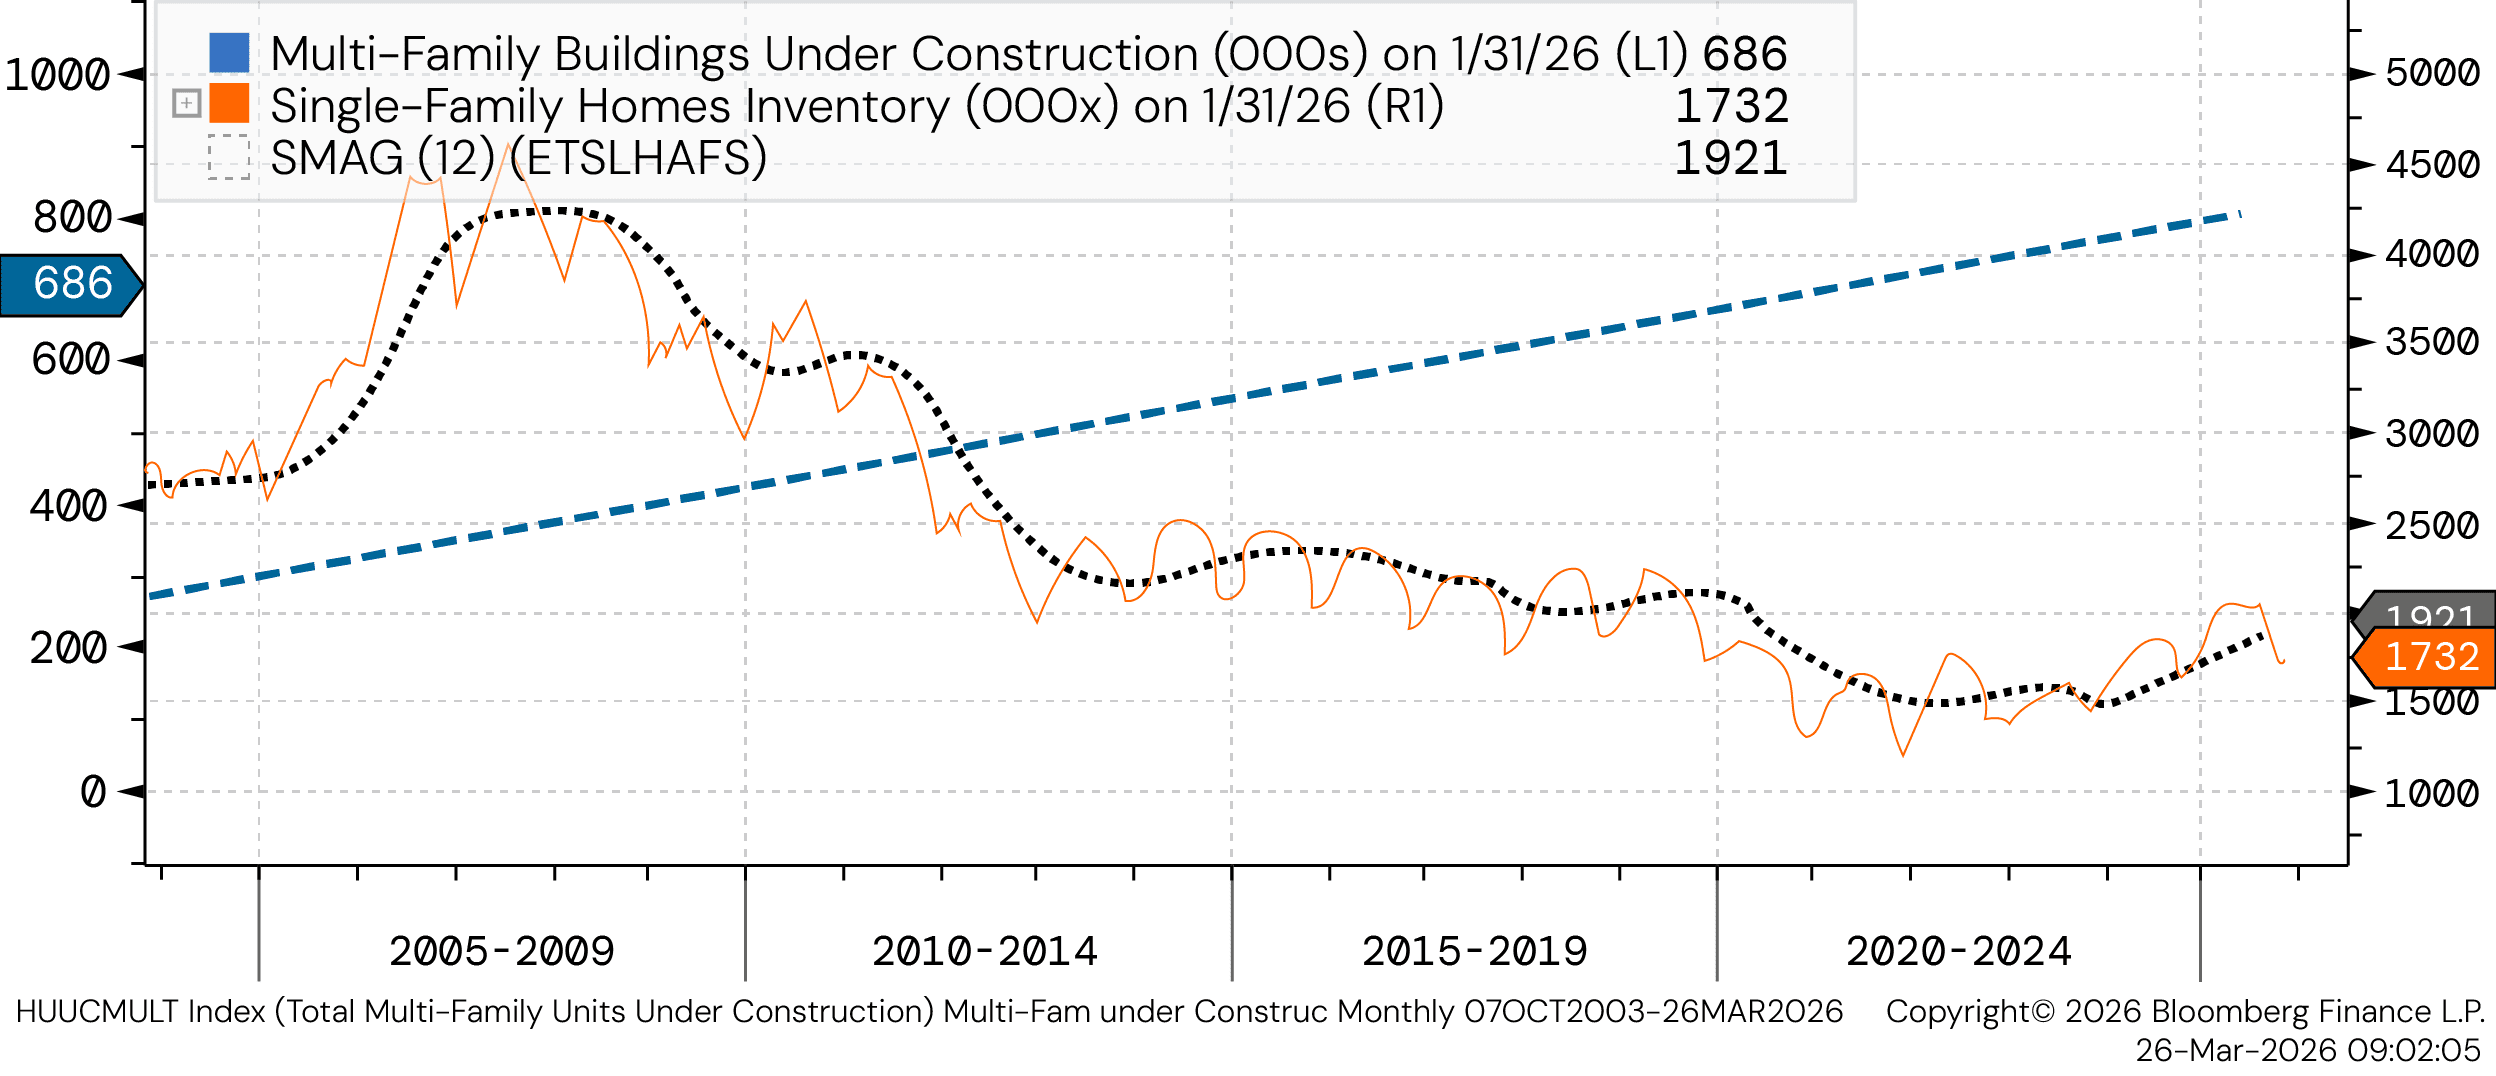
Source: Bloomberg Finance L.P.
Multifamily units under construction are declining from peak levels, while single‑family inventory continues to rebuild. These trends may ease future apartment supply pressure, but it also points to increased competition from homeownership.
What this means for you: Fundamentals may improve over time as deliveries slow, but near-term rent pressure could persist in certain markets, and the recovery may not be uniform. Operators may benefit from tracking local deliveries and absorption closely – especiaily in supply-heavy submarkets – so pricing, concessions, and renewal strategy can adjust early rather than after occupancy slips.
6. Rent Growth is Highly Local — and Supply is Driving the Story
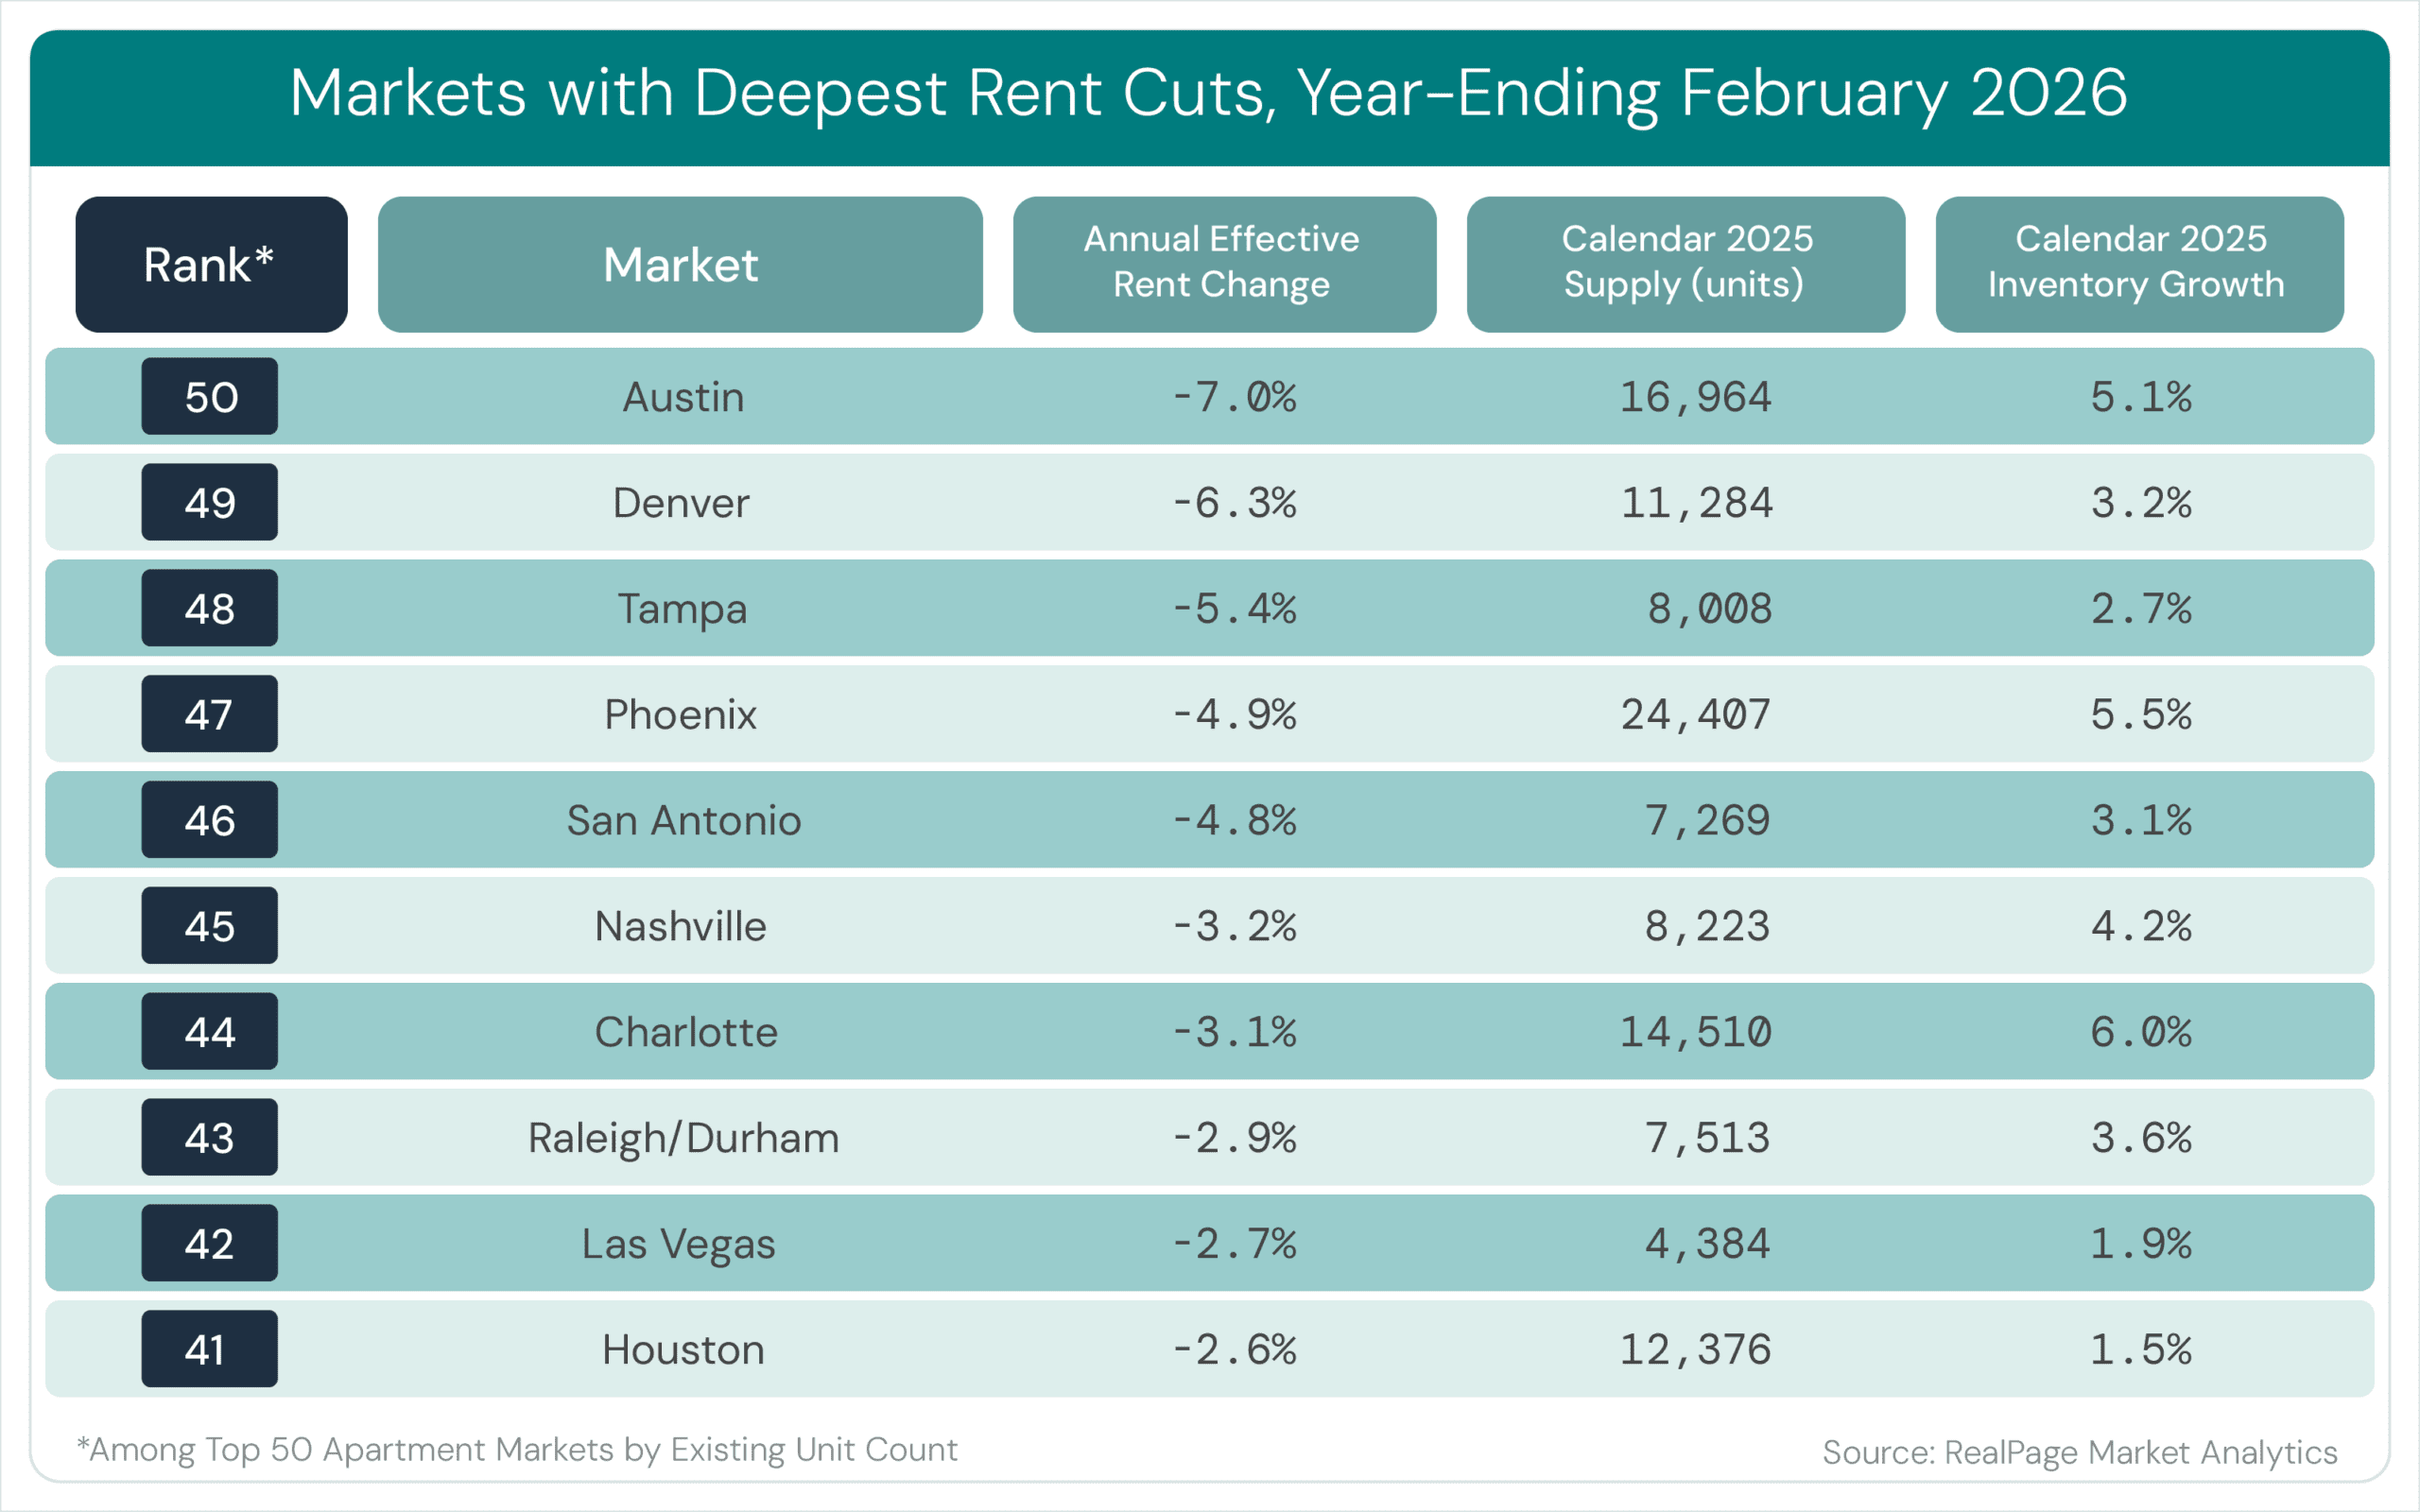
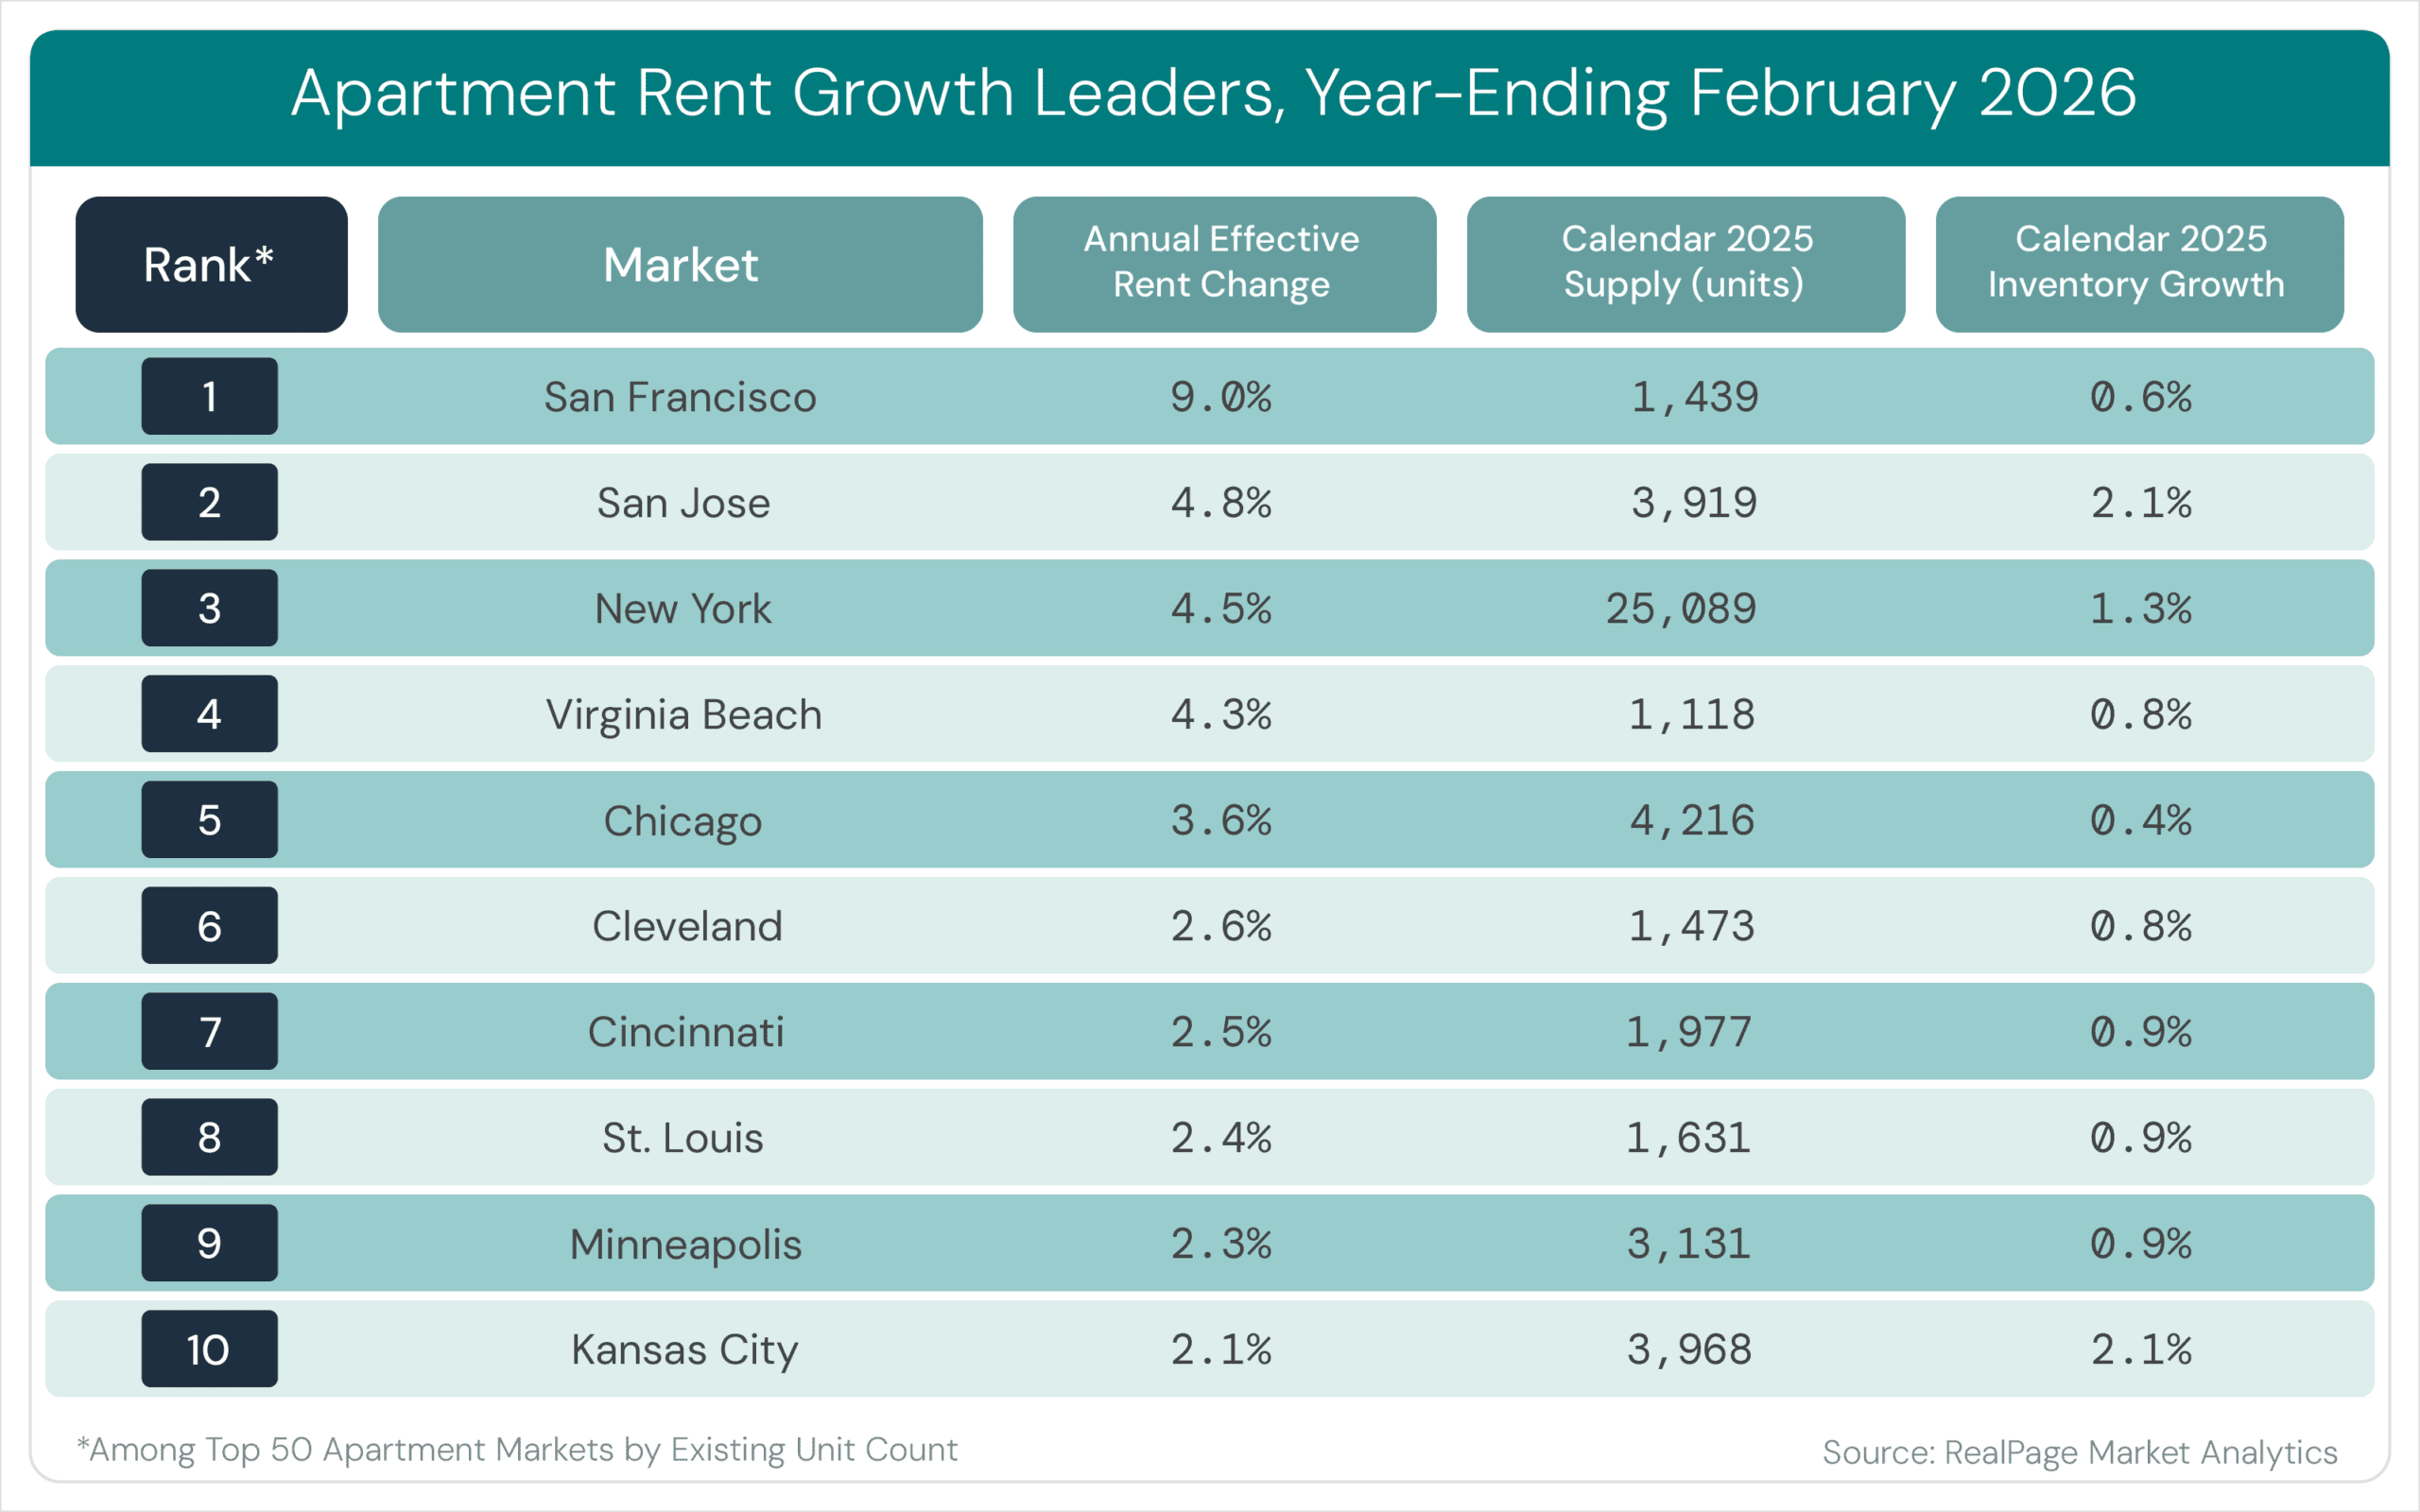
Source: RealPage Market Analytics
Rent trends are splitting by market: supply‑heavy Sunbelt metros continue to see declines, tourism markets remain soft, and tech‑driven coastal markets are leading with stronger rent growth, supported by demand and limited new supply. The key implication is dispersion: “national” rent narratives can hide very different local outcomes.
What this means for you: Market selection and submarket positioning may matter as much as asset type right now, because the same property can perform differently depending on local supply and demand. Underwriting rent growth locally – and stress-testing for additional concession pressure in supply-heavy markets – may produce more reliable plans than relying on national averages.
This commentary is brought to you by our advisors at Aprio.
Disclosures
Investment advisory services are offered by Aprio Wealth Management, LLC, a Securities and Exchange Commission Registered Investment Advisor. Opinions expressed are as of the publication date and subject to change without notice. Aprio Wealth Management, LLC shall not be responsible for any trading decisions, damages, or other losses resulting from, or related to, the information, data, analyses or opinions contained herein or their use, which do not constitute investment advice, are provided as of the date written, are provided solely for informational purposes and therefore are not an offer to buy or sell a security. This commentary is for informational purposes only and has not been tailored to suit any individual. References to specific securities or investment options should not be considered an offer to purchase or sell that specific investment.
This commentary contains certain forward-looking statements. Forward-looking statements involve known and unknown risks, uncertainties and other factors which may cause the actual results to differ materially and/or substantially from any future results, performance or achievements expressed or implied by those projected in the forward-looking statements for any reason. No graph, chart, or formula in this presentation can be used in and of itself to determine which securities to buy or sell, when to buy or sell securities, whether to invest using this investment strategy, or whether to engage Aprio Wealth Management, LLC’s investment advisory services.
Investments in securities are subject to investment risk, including possible loss of principal. Prices of securities may fluctuate from time to time and may even become valueless. Any securities mentioned in this commentary are not FDIC-insured, may lose value, and are not guaranteed by a bank or other financial institution. Before making any investment decision, investors should read and consider all the relevant investment product information. Investors should seriously consider if the investment is suitable for them by referencing their own financial position, investment objectives, and risk profile before making any investment decision. There can be no assurance that any financial strategy will be successful.
Certain investor qualifications may apply. Definitions for Qualified Purchaser, Qualified Client and Accredited Investor can be found from multiple sources online or in the SEC’s glossary found here https://www.sec.gov/education/glossary/jargon-z#Q