


At a glance:
-
- The main takeaway: The federal budget is a complex and difficult topic to fully grasp the amount of dollars that are generated as well as spent.
-
- Impact on individuals and businesses: It’s important to understand how the government structures the federal budget and spends revenue as each expenditure can affect individuals, businesses, and state and local governments.
-
- Next steps: Aprio’s Tax advisors are closely monitoring the tax landscape and are prepared to help you navigate the potential changes.
Schedule a consultation
The full story
As discussions around spending cuts, budget adjustments, deficit reduction, and the allocation of federal funds continue to make headlines, it’s important to understand the structure of the federal budget.
In this article, we breakdown:
-
- Key components of the budget
-
- Explain the sources of federal revenue
-
- Provide insight into past spending patterns
-
- Clarify the complexities of the government’s financial decisions
Federal budget overview
The Appropriations Clause of the U.S. Constitution establishes a rule of law to govern money contained in the U.S. Treasury. Under this clause, Congress is granted the
authority to specify the purpose, amount, and timing of federal spending, ensuring that no money can be drawn from the Treasury without the approval of Congress through specific appropriations. Additionally, this clause requires regular reporting on income and the expenditure of public funds.
Each year, Congress, the White House, and federal agencies begin work on the federal budget for the fiscal year, which begins October 1st and ends September 30th. This decentralized process starts with the passage of a budget resolution. If reconciliation directives are included in the budget resolution, Congress uses a special procedure known as budget reconciliation. After establishing broad targets for spending and revenue, Congress then uses the appropriation process to allocate funds to specific programs through legislation.
The task of developing appropriations legislation is delegated to the Appropriations Committees of the House and Senate. These committees have established 12 subcommittees, each tasked with drafting, managing, and overseeing the consideration of one appropriation act each fiscal year. In recent years Congress has not been able to agree on a full year budget. Instead, appropriations have been determined using a combination of short-term funding patches and continuing resolutions. Currently Congress is debating such a short-term measure to avoid a looming government shutdown.
Understanding the key components of the federal budget
The federal budget consists of two main categories — revenue, and spending.
Revenue – The federal government’s revenue comes from a variety of sources, including taxes, customs duties, and services. The largest sources of revenue are individual income and payroll taxes.
Spending – Federal spending is divided into three primary categories:
-
- Mandatory spending, also known as direct spending, is mandated by existing laws. This type of spending includes funding for programs like Medicare and Social Security and other payments to people, businesses, and state and local governments. Mandatory spending makes up two-thirds of the total federal budget.
-
- Discretionary spending is money approved by Congress and the President during the appropriations process each year. Annual funding is under the jurisdiction of the House and Senate Appropriations Committees.
-
- Interest on Debt – The final category of the federal budget is dedicated to paying the interest on the national debt. As debt grows, spending on interest expense grows as well.
Congress occasionally considers legislation that adds money for specific reasons outside of regular budget appropriations after the fiscal year has begun. Supplemental funding is provided in response to an unanticipated emergency. In 2020, Congress passed four supplemental appropriations to aid the nation’s recovery from the COVID-19 pandemic, increasing spending by 50%.
Revenue raised for the federal budget
The government raises money for the federal budget primarily through taxes, fees, and payments from agencies. These primary sources of income are generally governed by laws that remain in place until changed. Almost all revenue law is in the jurisdiction of the House Ways and Means Committee and the Senate Finance Committee. In 2023, federal receipts totaled $4.4 trillion, accounting for 16.5% of the gross domestic product.
Taxes
Most of the revenue collected by the U.S. government is from taxes paid by individual income taxes, corporate taxes, and payroll taxes. The government finances programs for buildings, roads, schools, veterans, Social Security, and Medicare through the collection of taxes.
Individual income taxes are the largest single source of federal revenues, constituting $2.51 trillion dollars in 2023.[1] The federal government collects taxes from individuals mainly from wages, interest, dividends, and capital gains and losses. The U.S. tax system is generally structured to be progressive, with higher-income taxpayers paying a larger share of their income in taxes. In 2019, the top quintile of earners paid 84% of all individual income taxes, while people in the two lowest income quintiles received more refundable tax credits than they owed in income taxes.
Both employers and employees contribute to payroll taxes. On average, lower income taxpayers pay more in payroll taxes, which accounts for about $1.57 trillion of total tax revenue and is the second-largest revenue source. Payroll taxes help fund Social Security, Medicare, and unemployment insurance. Employers also pay the federal unemployment tax, which finances state-run unemployment insurance programs
Generating $456 million dollars in revenue, corporate taxes are the third largest revenue stream for the federal budget. Corporate taxes have steadily decreased over time since the late 1960s, making the U.S. corporate tax revenue lower than most advanced countries. This decline can be attributed to both lower corporate tax rates and the rise of pass-through entities.
Fees
In 2023, the Securities and Exchange Commission (SEC) collected almost $5 billion financial remedies consisting of fines, disgorgement, and interest.
The federal securities laws direct the SEC to collect three different types of fees:
-
- Fees on the registration of securities
-
- Fees that are paid when securities are sold on exchanges and in the over-the-counter market
-
- Fees on mergers and tender offers that are required to be collected under various provisions in Section 13 and 14 of the Exchange Act that are paid when transaction documents are filed with the Commission.
While the SEC aims to return money to harmed investors whenever possible, challenges may arise in identifying affected investors, the costs of distribution exceeding the amount collected, or situations where the violation didn’t result in direct investor losses. In such instances, the funds may be directed to the U.S. Treasury.
Payments from Agencies
Government agencies can generate income through activities such as leasing land for development, selling natural resources, permits for fishing or hunting, and admission fees to enter national parks. Unlike taxes, fees collected for a government service or entry to a national park often support targeted funding of specific programs within the government.
In 2023, the Office of Natural Resources Revenue collected $18 billion dollars from companies who pay to produce energy and minerals on federal lands, Native American lands, and the Outer Continental Shelf. The payments these companies make include bonuses, rents, and royalties that were distributed to federal and local governments and Native Americans
Recreational activities such as hunting, fishing, and visiting national parks not only raise money for targeted governmental programs, they also often help stimulate the economy. The Department of the Interior’s National Park Service reported that in 2023, visitor spending in communities near national parks generated a record $55.6 billion for the U.S. economy and supported 415,400 jobs. In addition, the federal government raised billions of dollars in revenue from hunting and fishing licenses and excise taxes.
Other sources of revenue creation
Money creation is another potential source of raising government funds.
Seigniorage revenue is the difference between the face value of the minted coins and the actual market value of the precious metal they contain. This revenue is often used by governments to finance portions of their expenditures without collecting taxes. The resource costs of printing money are more often offset by the value of the goods purchased. Low production costs, however, must be balanced with the social costs of inflation, which can erode the purchasing power of money already in circulation.
A tariffis a tax levied on imported goods and services. Historically, tariffs were a major source of revenue for many countries and were often the primary source of federal revenue through the late-nineteenth century. Money from tariffs, paid by American companies, goes to the U.S. Department of Treasury and enters the general affairs budget. Revenues from tariffs could also be used to address the budget deficit or fund plans for tax cuts. Although the U.S. government collected around $80 billion dollars in revenue from tariffs in 2023, revenue can decline overtime due to reduced trade volume, retaliatory tariffs, and rising prices of consumer goods.
On Monday February 10, 2025, executive orders expanded Section 232 tariffs on steel and aluminum imports and are scheduled to go into effect March 12, 2025.
A breakdown of federal revenues is illustrated in the following chart:
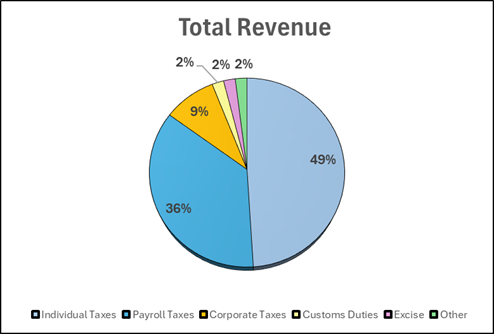
Source: Congressional Budget Office
Tax expenditures
As mentioned above, more than half of federal revenue comes from taxes. Tax expenditures are provisions within the tax code that can lower a taxpayer’s liability, thereby decreasing federal revenue. Tax exclusions, deductions, exemptions, and credits are all examples of how the U.S. government uses tax expenditures as an alternative to direct spending programs. Ductions and exclusions reduce the amount of income subject to tax while credits reduce tax liability. In 2023, the total cost of tax expenditures amounted to $1.8 trillion. Congress is currently debating whether to extend certain tax cuts from the Tax Cuts and Jobs Act (TCJA) of 2017, which are set to expire after 2025. Discussions surrounding the corporate tax rate, capital expensing, the pass-through income deduction, and international taxation directly impact U.S. businesses. Proposed changes to income tax rates, the standard deduction, itemized deductions, the child tax credit, and exemptions for overtime pay and tips will affect individual taxpayers.
Debt
Another way the United States funds its spending is through debt. This debt includes government issued treasury bonds, bills, and other notes as well as borrowing from other nations. Revenue has consistently been lower than the spending and the deficit has grown over the years. The debt has been necessary to fund the programs required to promote the welfare of the general public while the government runs at a deficit.
Spending
As discussed in the previous section, the U.S. government has been operating at a loss for quite some time. The question then becomes, “how is the money being spent?” The spending can be broken into three major categories, mandatory, discretionary, and interest.
Mandatory spending is governed by existing laws and includes spending on programs such as Medicare and Social Security which total over 50% of the mandatory category. The rest of the mandatory spending is made up of Medicaid and other income security programs. These items are mandatory because the amounts have already been appropriated by Congress and must be spent. However, there is a way for the executive branch to reduce or stop the spending of mandatory funds all together, which is known as rescission.
The next category of spending is known as discretionary spending which consists of a 55/45 split between defense and nondefense spending. In the fiscal year 2023, discretionary spending totaled $1.722 trillion dollars. This was broken up with $937 billion going to the defense department and $785 billion to nondefense categories.[2] Within the defense spending:
-
- Operation and maintenance costs were the leading category, totaling $317 billion or roughly 34% of the total spending on defense. Common expenses within the operations and maintenance category include department of defense civilian salaries, maintenance of equipment, supplies, real property, food, and clothing.
-
- Personnel costs totaled $173 billion and includes the salaries of the active duty and reserve military members.
-
- Procurement of equipment, such as aircraft, ships, and land vehicles, is the third largest defense category totaling $142 billion.
-
- Veterans’ benefits are the next highest cost, accounting for 14% of the $937 billion in defense spending. This 14% equated to $131 billion in 2023.
-
- The U.S. government invested $122 billion into research and testing of new equipment, computer software, and materials, along with another $52 billion in other military expenditures such as housing and atomic energy projects.
The nondefense category accounted for $785 billion worth of spending in 2023. Within the nondefense category:
-
- The top two expenditures are education & social services and transportation totaling $125 and $115 billion respectively.
-
- The next two categories, health and income security, both cost $100 billion. Health spending includes funding of agencies like the CDC, FDA, and HRSA along with spending on research while income security includes items such as unemployment compensation and housing and food assistance programs.
-
- The U.S. government spent $83 billion on international affairs in 2023, a category that includes humanitarian efforts as well as spending on international security.
-
- Federal law enforcement, judicial services, and correctional operations make up the $74 billion spent within the administration of justice category.
Other spending categories include: The next three spending categories used $48, $41 and $40 billion respectively in FY 2023.
-
- Natural resources and the environment spent a total of $48 billion in 2023 and includes conservation efforts, drinking water quality programs, as well as habitat restoration.
-
- Community development, which consists of redevelopment projects and the construction and support of new housing, spent $41 billion in 2023.
-
- General science, technology, and space, which consists of programs for general research and development within health and civil sectors, spent $40 billion and also includes government spending on NASA, which can reach to about half of the $40 billion dollar total.
-
- The last $59 billion is allocated to miscellaneous categories such as agriculture, energy, and commerce.
The final category of government spending is interest on the national debt. As previously discussed, the government has been operating at a deficit causing the debt to grow consistently. The debt costs the U.S. government roughly $659 billion dollars in 2023, a figure that will continue to grow as the debt increases. A breakdown of federal spending is illustrated by the chart below:
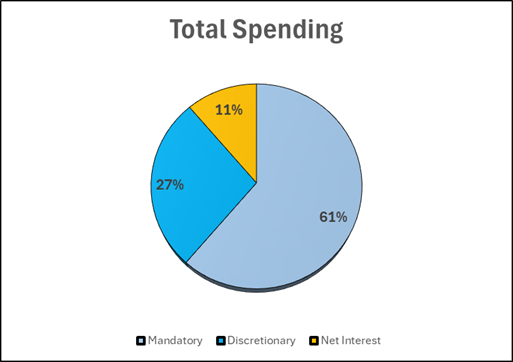
Source: Congressional Budget Office
Impoundment and rescission of federal funds
When funds are appropriated by Congress, they must be legally spent in the time Congress specified. If the funds are not spent in the allowed timeframe, it is known as an impoundment. More specifically, an impoundment is defined as any action taken that would delay or permanently stop funds that are obligated to be spent. The Impoundment Control Act of 1974 came in response to executive overreach. The removal of the impoundment power created a stronger check and balance between the executive and the legislative branch.
The executive branch can combat this through a process called rescission. This process involves submitting a message and law to Congress to suggest the purpose and the amount of funds that are proposed to be reduced. Once the message, outlining the reasons for the recession and the budgetary and economic impacts, reaches Congress, the executive branch can withhold the funds for up to 45 days while Congress reviews the request. In those 45 days Congress can approve, deny or ignore the request. If the request is not approved the funds must be spent as originally intended.
How the debt ceiling impacts federal spending
As discussed, the government operates at a deficit, spending more than its revenues. Prior to 1917 Congress had to authorize each individual debt issuance, until the debt ceiling was created. The debt ceiling is the amount that the government is allowed to borrow at any given time. This amount is set by Congress and as of 2023 the ceiling totals $31.4 trillion and as the government continues operating at a deficit the debt will draw closer to the ceiling.
When the debt gets close to the ceiling there are two things that Congress can do, the ceiling can either be raised or suspended entirely. If the ceiling is raised, the government can continue borrowing up until the new ceiling. Conversely, if the ceiling is suspended, the government has more freedom to borrow through the suspension period and a new debt ceiling will be put in place to cover any increases in the debt. If the debt ceiling is broken the Treasury is authorized to take extraordinary measures to limit any further increases to the debt while a new ceiling is discussed in Congress. These extraordinary measures include pausing daily reinvestment of government funds, which allows for the government to free up space to issue debt to the public to raise cash. If the debt ceiling is raised, it does not allow for an increase in spending beyond what is already obligated by Congress, it is to ensure room for the funds that have already been appropriated.
How state revenue is tied to the federal budget
Anywhere from 10-30% of a state’s revenue comes from the federal government, making all 50 states the largest beneficiaries of government spending. Because most states operate with balanced budgets and cannot run at a deficit, fluctuations in government funding can pose significant issues for local policymakers having to choose local spending adjustments. Within the states, federal funds are used for things such as healthcare, schools, roads, and public safety.
Each state does not benefit equally from federal funding. For example, California received $162 billion dollars or 14.5% of its total revenues from the federal government in 2021. On the other hand, Montana received only $6.3 billion, but this equated to 31.8% of Montana’s total revenue. Pure dollar amounts do not tell the full story in this case as California received a much greater amount, but California also generated much more revenue. The funds given to states are determined by several factors that are often unique to each state. Some grants are given with a specific purpose, such as a highway project, while block grants give the locality the authority to allocate how they see fit.
The bottom line
The federal budget is a complex topic, and it can be difficult to fully grasp the sheer number of dollars being generated as well as spent. It is important to understand how the government spends revenue as each expenditure affects individuals and businesses as well as state and local governments.
As discussed, the 2023 budget consisted of $6.1 trillion dollars of total spending, broken out into $3.8 trillion in mandatory spending, $1.7 trillion in discretionary, and $659 billion in interest on the current debt. The government covered these expenses through revenues from individual, payroll, and corporate taxes totaling $4.4 trillion and issued debt to cover the deficit.
Aprio’s Tax Advisors are closely monitoring the tax landscape and are prepared to help you navigate the potential changes.
Related Articles
Budget Reconciliation: What is it and How Does it Work?
President Trump Announces Tariffs on Imports from Canada, Mexico, and China
[1] Source: Congressional Budget Office, https://www.cbo.gov/
[2] Source: Congressional Budget Office, https://www.cbo.gov/